


Huntington town, Suffolk County, New York
About
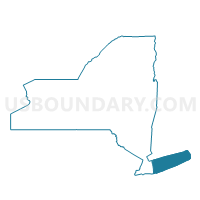
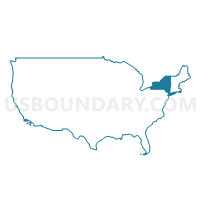
Outline

Summary
| Unique Area Identifier | 143434 |
| Name | Huntington town |
| County | Suffolk County |
| State | New York |
| Area (square miles) | 137.11 |
| Land Area (square miles) | 94.12 |
| Water Area (square miles) | 42.99 |
| % of Land Area | 68.65 |
| % of Water Area | 31.35 |
| Latitude of the Internal Point | 40.88408860 |
| Longtitude of the Internal Point | -73.37676080 |
| Total Population | 203,264 |
| Total Housing Units | 71,948 |
| Total Households | 69,311 |
| Median Age | 42.5 |
Maps

Graphs
Select a template below for downloading or customizing gragh for Huntington town, Suffolk County, New York


Neighbors
Neighoring County Subdivision (by Name) Neighboring County Subdivision on the Map
- Babylon town, Suffolk County, NY
- County subdivisions not defined, Fairfield County, CT
- Islip town, Suffolk County, NY
- Oyster Bay town, Nassau County, NY
- Smithtown town, Suffolk County, NY
Top 10 Neighboring Place (by Population) Neighboring Place on the Map
- Brentwood CDP, NY (60,664)
- Commack CDP, NY (36,124)
- Huntington Station CDP, NY (33,029)
- Deer Park CDP, NY (27,745)
- Dix Hills CDP, NY (26,892)
- Plainview CDP, NY (26,217)
- East Northport CDP, NY (20,217)
- Melville CDP, NY (18,985)
- Huntington CDP, NY (18,046)
- Greenlawn CDP, NY (13,742)
Top 10 Neighboring Unified School District (by Population) Neighboring Unified School District on the Map
- Brentwood Union Free School District, NY (87,253)
- Half Hollow Hills Central School District, NY (48,558)
- South Huntington Union Free School District, NY (38,650)
- Commack Union Free School District, NY (37,453)
- Northport-East Northport Union Free School District, NY (36,113)
- Huntington Union Free School District, NY (34,810)
- Syosset Central School District, NY (34,200)
- Plainview-Old Bethpage Central School District, NY (28,676)
- Deer Park Union Free School District, NY (25,760)
- Kings Park Central School District, NY (22,894)
Top 10 Neighboring State Legislative District Lower Chamber (by Population) Neighboring State Legislative District Lower Chamber on the Map
- Assembly District 6, NY (145,372)
- Assembly District 10, NY (138,509)
- Assembly District 11, NY (135,087)
- Assembly District 7, NY (134,480)
- Assembly District 13, NY (131,694)
- Assembly District 9, NY (130,285)
- State House Districts not defined, CT (0)
Top 10 Neighboring State Legislative District Upper Chamber (by Population) Neighboring State Legislative District Upper Chamber on the Map
- State Senate District 5, NY (316,844)
- State Senate District 2, NY (314,159)
- State Senate District 4, NY (309,135)
- State Senate District 6, NY (307,789)
- State Senate District 8, NY (305,226)
- State Senate Districts not defined, CT (0)
Top 10 Neighboring 111th Congressional District (by Population) Neighboring 111th Congressional District on the Map
- Congressional District 1, NY (705,559)
- Congressional District 2, NY (679,893)
- Congressional District 3, NY (645,508)
Top 10 Neighboring Census Tract (by Population) Neighboring Census Tract on the Map
- Census Tract 1111, Suffolk County, NY (8,853)
- Census Tract 1122.06, Suffolk County, NY (8,271)
- Census Tract 1106, Suffolk County, NY (7,401)
- Census Tract 1122.10, Suffolk County, NY (7,039)
- Census Tract 1122.14, Suffolk County, NY (7,003)
- Census Tract 1456.03, Suffolk County, NY (6,843)
- Census Tract 1115.05, Suffolk County, NY (6,486)
- Census Tract 2011, Suffolk County, NY (6,415)
- Census Tract 1118.01, Suffolk County, NY (6,241)
- Census Tract 1108.03, Suffolk County, NY (5,973)
Top 10 Neighboring 5-Digit ZIP Code Tabulation Area (by Population) Neighboring 5-Digit ZIP Code Tabulation Area on the Map
- 11746, NY (67,094)
- 11717, NY (60,745)
- 11743, NY (42,230)
- 11735, NY (32,098)
- 11731, NY (30,184)
- 11725, NY (29,150)
- 11803, NY (28,127)
- 11729, NY (28,032)
- 11791, NY (25,076)
- 11768, NY (21,902)
Data
Demographic, Population, Households, and Housing Units
** Data sources from census 2010 **
Show Data on Map
Download Full List as CSV
Download Quick Sheet as CSV
| Subject | This Area | Suffolk County | New York | National |
|---|---|---|---|---|
| POPULATION | ||||
| Total Population Map | 203,264 | 1,493,350 | 19,378,102 | 308,745,538 |
| POPULATION, HISPANIC OR LATINO ORIGIN | ||||
| Not Hispanic or Latino Map | 180,902 | 1,247,111 | 15,961,180 | 258,267,944 |
| Hispanic or Latino Map | 22,362 | 246,239 | 3,416,922 | 50,477,594 |
| POPULATION, RACE | ||||
| White alone Map | 171,048 | 1,206,297 | 12,740,974 | 223,553,265 |
| Black or African American alone Map | 9,515 | 111,224 | 3,073,800 | 38,929,319 |
| American Indian and Alaska Native alone Map | 398 | 5,366 | 106,906 | 2,932,248 |
| Asian alone Map | 10,089 | 50,972 | 1,420,244 | 14,674,252 |
| Native Hawaiian and Other Pacific Islander alone Map | 48 | 495 | 8,766 | 540,013 |
| Some Other Race alone Map | 7,898 | 82,965 | 1,441,563 | 19,107,368 |
| Two or More Races Map | 4,268 | 36,031 | 585,849 | 9,009,073 |
| POPULATION, SEX | ||||
| Male Map | 100,042 | 734,668 | 9,377,147 | 151,781,326 |
| Female Map | 103,222 | 758,682 | 10,000,955 | 156,964,212 |
| POPULATION, AGE (18 YEARS) | ||||
| 18 years and over Map | 152,755 | 1,135,680 | 15,053,173 | 234,564,071 |
| Under 18 years | 50,509 | 357,670 | 4,324,929 | 74,181,467 |
| POPULATION, AGE | ||||
| Under 5 years | 10,804 | 85,984 | 1,155,822 | 20,201,362 |
| 5 to 9 years | 14,242 | 97,819 | 1,163,955 | 20,348,657 |
| 10 to 14 years | 15,798 | 106,367 | 1,211,456 | 20,677,194 |
| 15 to 17 years | 9,665 | 67,500 | 793,696 | 12,954,254 |
| 18 and 19 years | 3,918 | 39,492 | 572,582 | 9,086,089 |
| 20 years | 1,802 | 19,198 | 293,083 | 4,519,129 |
| 21 years | 1,833 | 18,184 | 281,596 | 4,354,294 |
| 22 to 24 years | 5,898 | 52,989 | 836,256 | 12,712,576 |
| 25 to 29 years | 8,847 | 81,668 | 1,380,177 | 21,101,849 |
| 30 to 34 years | 9,311 | 85,017 | 1,279,160 | 19,962,099 |
| 35 to 39 years | 11,628 | 96,447 | 1,254,124 | 20,179,642 |
| 40 to 44 years | 16,284 | 116,894 | 1,355,893 | 20,890,964 |
| 45 to 49 years | 18,553 | 128,459 | 1,458,763 | 22,708,591 |
| 50 to 54 years | 17,402 | 117,323 | 1,419,928 | 22,298,125 |
| 55 to 59 years | 14,106 | 94,938 | 1,237,408 | 19,664,805 |
| 60 and 61 years | 4,952 | 34,347 | 453,993 | 7,113,727 |
| 62 to 64 years | 6,953 | 48,931 | 612,267 | 9,704,197 |
| 65 and 66 years | 3,915 | 26,870 | 330,160 | 5,319,902 |
| 67 to 69 years | 5,428 | 35,782 | 443,051 | 7,115,361 |
| 70 to 74 years | 6,819 | 45,331 | 587,391 | 9,278,166 |
| 75 to 79 years | 5,847 | 36,789 | 474,807 | 7,317,795 |
| 80 to 84 years | 4,689 | 29,180 | 391,660 | 5,743,327 |
| 85 years and over | 4,570 | 27,841 | 390,874 | 5,493,433 |
| MEDIAN AGE BY SEX | ||||
| Both sexes Map | 42.50 | 39.80 | 38.00 | 37.20 |
| Male Map | 41.20 | 38.40 | 36.30 | 35.80 |
| Female Map | 43.70 | 41.10 | 39.40 | 38.50 |
| HOUSEHOLDS | ||||
| Total Households Map | 69,311 | 499,922 | 7,317,755 | 116,716,292 |
| HOUSEHOLDS, HOUSEHOLD TYPE | ||||
| Family households: Map | 53,287 | 370,897 | 4,649,791 | 77,538,296 |
| Husband-wife family Map | 44,062 | 287,935 | 3,192,903 | 56,510,377 |
| Other family: Map | 9,225 | 82,962 | 1,456,888 | 21,027,919 |
| Male householder, no wife present Map | 2,637 | 24,697 | 366,948 | 5,777,570 |
| Female householder, no husband present Map | 6,588 | 58,265 | 1,089,940 | 15,250,349 |
| Nonfamily households: Map | 16,024 | 129,025 | 2,667,964 | 39,177,996 |
| Householder living alone Map | 12,838 | 102,900 | 2,130,670 | 31,204,909 |
| Householder not living alone Map | 3,186 | 26,125 | 537,294 | 7,973,087 |
| HOUSEHOLDS, HISPANIC OR LATINO ORIGIN OF HOUSEHOLDER | ||||
| Not Hispanic or Latino householder: Map | 64,613 | 446,642 | 6,311,241 | 103,254,926 |
| Hispanic or Latino householder: Map | 4,698 | 53,280 | 1,006,514 | 13,461,366 |
| HOUSEHOLDS, RACE OF HOUSEHOLDER | ||||
| Householder who is White alone | 61,466 | 429,371 | 5,169,163 | 89,754,352 |
| Householder who is Black or African American alone | 2,627 | 31,482 | 1,095,790 | 14,129,983 |
| Householder who is American Indian and Alaska Native alone | 98 | 1,441 | 33,824 | 939,707 |
| Householder who is Asian alone | 2,791 | 13,510 | 445,652 | 4,632,164 |
| Householder who is Native Hawaiian and Other Pacific Islander alone | 12 | 128 | 2,615 | 143,932 |
| Householder who is Some Other Race alone | 1,515 | 16,637 | 405,320 | 4,916,427 |
| Householder who is Two or More Races | 802 | 7,353 | 165,391 | 2,199,727 |
| HOUSEHOLDS, HOUSEHOLD TYPE BY HOUSEHOLD SIZE | ||||
| Family households: Map | 53,287 | 370,897 | 4,649,791 | 77,538,296 |
| 2-person household Map | 19,109 | 125,050 | 1,785,206 | 31,882,616 |
| 3-person household Map | 11,737 | 83,058 | 1,109,716 | 17,765,829 |
| 4-person household Map | 12,737 | 85,685 | 944,590 | 15,214,075 |
| 5-person household Map | 6,075 | 44,082 | 461,667 | 7,411,997 |
| 6-person household Map | 2,064 | 17,329 | 189,577 | 3,026,278 |
| 7-or-more-person household Map | 1,565 | 15,693 | 159,035 | 2,237,501 |
| Nonfamily households: Map | 16,024 | 129,025 | 2,667,964 | 39,177,996 |
| 1-person household Map | 12,838 | 102,900 | 2,130,670 | 31,204,909 |
| 2-person household Map | 2,507 | 20,591 | 430,564 | 6,360,012 |
| 3-person household Map | 413 | 2,905 | 66,787 | 992,156 |
| 4-person household Map | 130 | 1,282 | 24,877 | 411,171 |
| 5-person household Map | 61 | 639 | 8,596 | 126,634 |
| 6-person household Map | 23 | 282 | 3,400 | 48,421 |
| 7-or-more-person household Map | 52 | 426 | 3,070 | 34,693 |
| HOUSING UNITS | ||||
| Total Housing Units Map | 71,948 | 569,985 | 8,108,103 | 131,704,730 |
| HOUSING UNITS, OCCUPANCY STATUS | ||||
| Occupied Map | 69,311 | 499,922 | 7,317,755 | 116,716,292 |
| Vacant Map | 2,637 | 70,063 | 790,348 | 14,988,438 |
| HOUSING UNITS, OCCUPIED, TENURE | ||||
| Owned with a mortgage or a loan Map | 40,813 | 286,755 | 2,610,123 | 52,979,430 |
| Owned free and clear Map | 17,326 | 106,752 | 1,287,714 | 23,006,644 |
| Renter occupied Map | 11,172 | 106,415 | 3,419,918 | 40,730,218 |
| HOUSING UNITS, VACANT, VACANCY STATUS | ||||
| For rent Map | 549 | 6,778 | 200,039 | 4,137,567 |
| Rented, not occupied Map | 35 | 502 | 12,786 | 206,825 |
| For sale only Map | 537 | 6,138 | 77,225 | 1,896,796 |
| Sold, not occupied Map | 147 | 1,295 | 21,027 | 421,032 |
| For seasonal, recreational, or occasional use Map | 657 | 46,460 | 289,301 | 4,649,298 |
| For migrant workers Map | 1 | 33 | 892 | 24,161 |
| Other vacant Map | 711 | 8,857 | 189,078 | 3,652,759 |
| HOUSING UNITS, OCCUPIED, AVERAGE HOUSEHOLD SIZE BY TENURE | ||||
| Total: Map | 2.89 | 2.93 | 2.57 | 2.58 |
| Owner occupied Map | 2.96 | 3.03 | 2.71 | 2.65 |
| Renter occupied Map | 2.53 | 2.56 | 2.41 | 2.44 |
| HOUSING UNITS, OCCUPIED, TENURE BY RACE OF HOUSEHOLDER | ||||
| Owner occupied: Map | 58,139 | 393,507 | 3,897,837 | 75,986,074 |
| Householder who is White alone Map | 52,921 | 349,694 | 3,237,592 | 63,446,275 |
| Householder who is Black or African American alone Map | 1,595 | 19,117 | 325,395 | 6,261,464 |
| Householder who is American Indian and Alaska Native alone Map | 49 | 901 | 11,250 | 509,588 |
| Householder who is Asian alone Map | 2,384 | 9,975 | 197,011 | 2,688,861 |
| Householder who is Native Hawaiian and Other Pacific Islander alone Map | 9 | 70 | 741 | 61,911 |
| Householder who is Some Other Race alone Map | 664 | 9,013 | 74,243 | 1,975,817 |
| Householder who is Two or More Races Map | 517 | 4,737 | 51,605 | 1,042,158 |
| Renter occupied: Map | 11,172 | 106,415 | 3,419,918 | 40,730,218 |
| Householder who is White alone Map | 8,545 | 79,677 | 1,931,571 | 26,308,077 |
| Householder who is Black or African American alone Map | 1,032 | 12,365 | 770,395 | 7,868,519 |
| Householder who is American Indian and Alaska Native alone Map | 49 | 540 | 22,574 | 430,119 |
| Householder who is Asian alone Map | 407 | 3,535 | 248,641 | 1,943,303 |
| Householder who is Native Hawaiian and Other Pacific Islander alone Map | 3 | 58 | 1,874 | 82,021 |
| Householder who is Some Other Race alone Map | 851 | 7,624 | 331,077 | 2,940,610 |
| Householder who is Two or More Races Map | 285 | 2,616 | 113,786 | 1,157,569 |
| HOUSING UNITS, OCCUPIED, TENURE BY HISPANIC OR LATINO ORIGIN OF HOUSEHOLDER | ||||
| Owner occupied: Map | 58,139 | 393,507 | 3,897,837 | 75,986,074 |
| Not Hispanic or Latino householder Map | 55,494 | 361,201 | 3,664,784 | 69,617,625 |
| Hispanic or Latino householder Map | 2,645 | 32,306 | 233,053 | 6,368,449 |
| Renter occupied: Map | 11,172 | 106,415 | 3,419,918 | 40,730,218 |
| Not Hispanic or Latino householder Map | 9,119 | 85,441 | 2,646,457 | 33,637,301 |
| Hispanic or Latino householder Map | 2,053 | 20,974 | 773,461 | 7,092,917 |
| HOUSING UNITS, OCCUPIED, TENURE BY HOUSEHOLD SIZE | ||||
| Owner occupied: Map | 58,139 | 393,507 | 3,897,837 | 75,986,074 |
| 1-person household Map | 8,529 | 65,239 | 860,611 | 16,453,569 |
| 2-person household Map | 18,869 | 118,230 | 1,304,752 | 27,618,605 |
| 3-person household Map | 10,652 | 70,176 | 660,251 | 12,517,563 |
| 4-person household Map | 11,688 | 74,925 | 606,580 | 10,998,793 |
| 5-person household Map | 5,508 | 38,172 | 279,929 | 5,057,765 |
| 6-person household Map | 1,758 | 14,449 | 106,323 | 1,965,796 |
| 7-or-more-person household Map | 1,135 | 12,316 | 79,391 | 1,373,983 |
| Renter occupied: Map | 11,172 | 106,415 | 3,419,918 | 40,730,218 |
| 1-person household Map | 4,309 | 37,661 | 1,270,059 | 14,751,340 |
| 2-person household Map | 2,747 | 27,411 | 911,018 | 10,624,023 |
| 3-person household Map | 1,498 | 15,787 | 516,252 | 6,240,422 |
| 4-person household Map | 1,179 | 12,042 | 362,887 | 4,626,453 |
| 5-person household Map | 628 | 6,549 | 190,334 | 2,480,866 |
| 6-person household Map | 329 | 3,162 | 86,654 | 1,108,903 |
| 7-or-more-person household Map | 482 | 3,803 | 82,714 | 898,211 |
Loading...